UK roads have been found to be operating at their slowest speeds in four years, according to the latest Department for Transport statistics.
The report found that average speeds on major roads have plummeted to record lows, with local A-roads now crawling at just 23mph, down 1.7 per cent from last year.
The Strategic Road Network, which includes motorways and major A-roads managed by National Highways, has seen speeds drop to 55.9 mph, a 1.9 per cent decrease from 2023.
The report detailed how delays have worsened significantly over the years, with motorists now facing longer journey times across all major road networks.
Do you have a story you’d like to share? Get in touch by emailing[email protected]
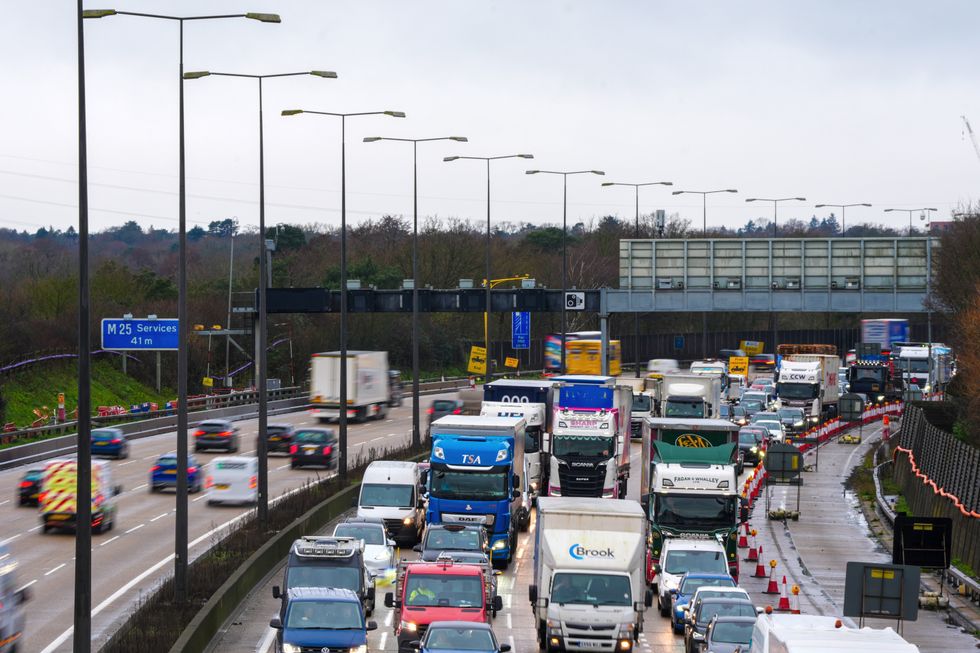
Motorways are currently operating at 55.9mph a drop by 1.9 per cent
PA
The latest figures from the DfT, which were released today, revealed a continuing downward trend in road speeds across England.
This continues a pattern of declining speeds since 2020, when average speeds were 24.7mph during the height of pandemic restrictions.
The Department’s data revealed that speeds have been steadily falling as traffic returns to pre-pandemic levels.
Meanwhile delays on local A-roads have increased significantly, reaching 48.3 seconds per vehicle per mile in 2024.
This represents a 3.4 per cent rise from 46.7 seconds recorded in 2023, according to the Department for Transport’s figures.
The data also showed a consistent upward trend in delays since 2020, when the average delay was just 40.3 seconds per vehicle per mile.
However, evening peak times between 4pm and 7pm experienced the worst congestion, with delays reaching 65.4 seconds per vehicle per mile, showing a three per cent increase from 2023.
Morning rush hour also saw significant delays, averaging 56.2 seconds per vehicle per mile.
Delays on the SRN have increased dramatically, rising by 11.4 per cent to reach 11.7 seconds per vehicle per mile.
This was seen to be significantly worse than pre-pandemic levels, when delays typically remained stable between 8.6 and nine seconds per vehicle per mile.
The Greater London Authority area experienced the slowest SRN speeds at just 47.6mph, down from 51.4mph in 2023.
Urban roads have seen a significant slowdown, with average speeds of just 16.2mph in 2024, down 1.8 per cent from 16.5mph in 2023.
Rural A-roads performed better but still declined, averaging 33.6mph, a two per cent drop from 34.3mph the previous year.
But delays on urban roads reached 83.6 seconds per vehicle per mile, up 3.9 per cent from 2023. Rural roads saw delays increase by 4.7 per cent to 22.2 seconds per vehicle per mile.
The Department for Transport noted that urban roads generally have lower free flow speeds than rural roads, resulting in higher levels of delay.
London experienced the worst congestion nationwide, with the Greater London Authority area recording average delays of 110.6 seconds per vehicle per mile on local A-roads.
LATEST DEVELOPMENTS:
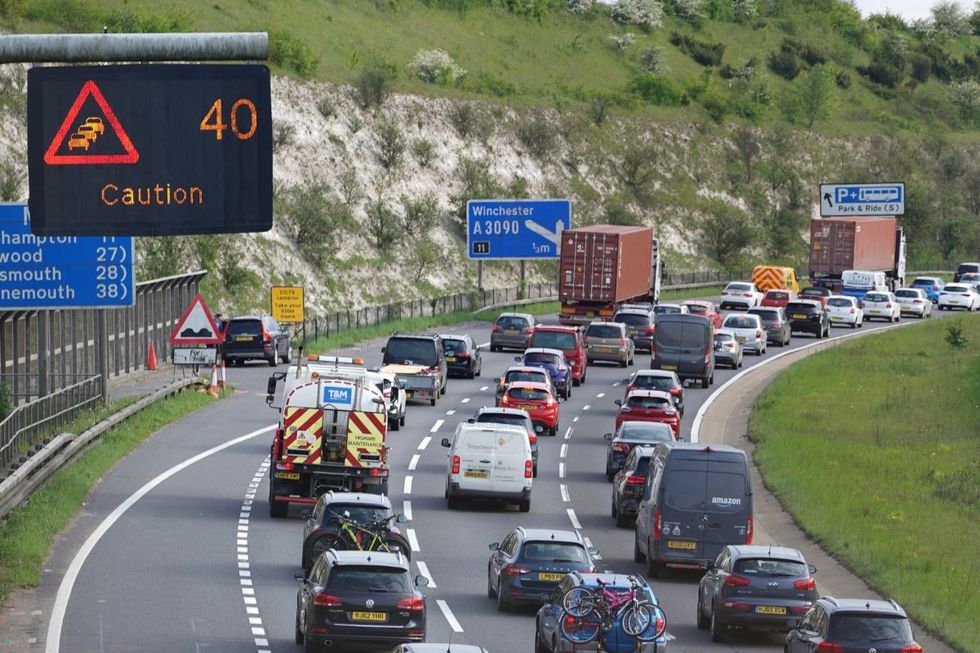
The Strategic Road Network saw delays increase by 11.4 per cent
PA
Several London boroughs saw significant increases in delays due to extensive roadworks, including Hammersmith and Fulham, Kensington & Chelsea, Camden, City of London, and Westminster.
Outside the capital, authorities including Oldham, Bolton, Salford, and Rochdale faced major infrastructure works.
Key projects included Oldham Road improvements, upgrades to the A580 East Lancashire Road, and temporary closures for repairs and resurfacing.
The southeast region was particularly affected by the construction of new emergency areas throughout 2024.
The transport authority noted that “most road traffic has trended back towards levels seen before the pandemic” with congestion now exceeding pre-pandemic figures.