The average speed limits on UK roads have fallen drastically as congestion and roadworks continue to impact travel on major motorways and A roads.
The speed limits were revealed in the latest figures from the Department for Transport, released today, which showed that average speeds were 56.2mph for the year ending September 2024.
The decline in average speeds coincides with an increase in delays, with drivers now experiencing an average delay of 11.4 seconds per vehicle per mile compared to free-flow conditions.
This represents a significant 10.7 per cent rise in delays from the same period last year, according to department figures.
Do you have a story you’d like to share? Get in touch by emailing[email protected]

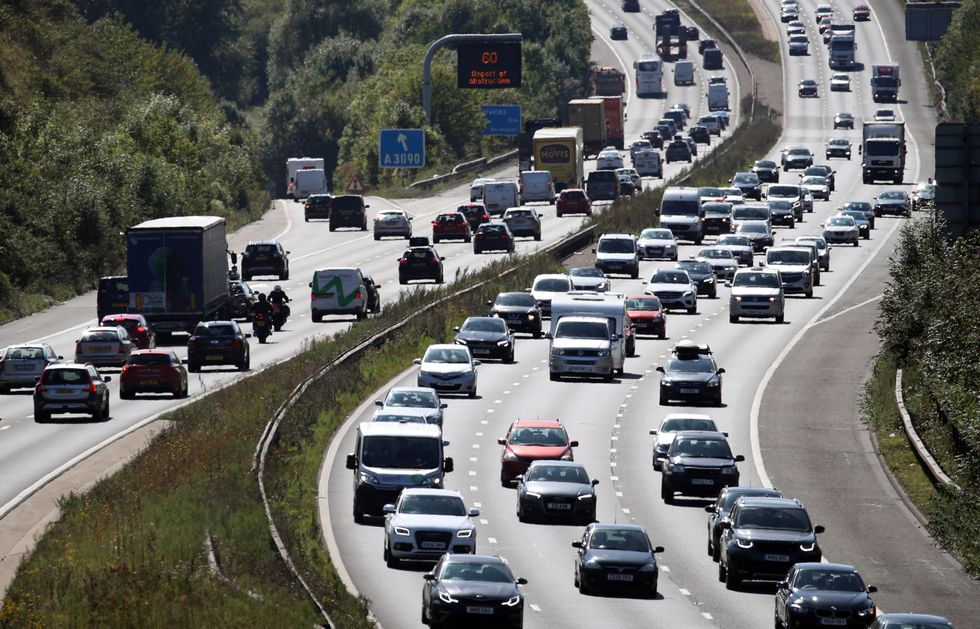
M6 Toll emerged as England’s fastest route, with vehicles averaging 66.2mph
PA
The report found that the M6 Toll emerged as England’s fastest route, with vehicles averaging 66.2mph. Other high-performing motorways include the M50 at 66mph and the M40 maintaining speeds of 65.6mph.
The M69 and M23 also demonstrated strong performance, recording 65.3mph and 65.1mph respectively. Meanwhile, the A74(M) stands out as one of the fastest A-roads, averaging 65.2mph.
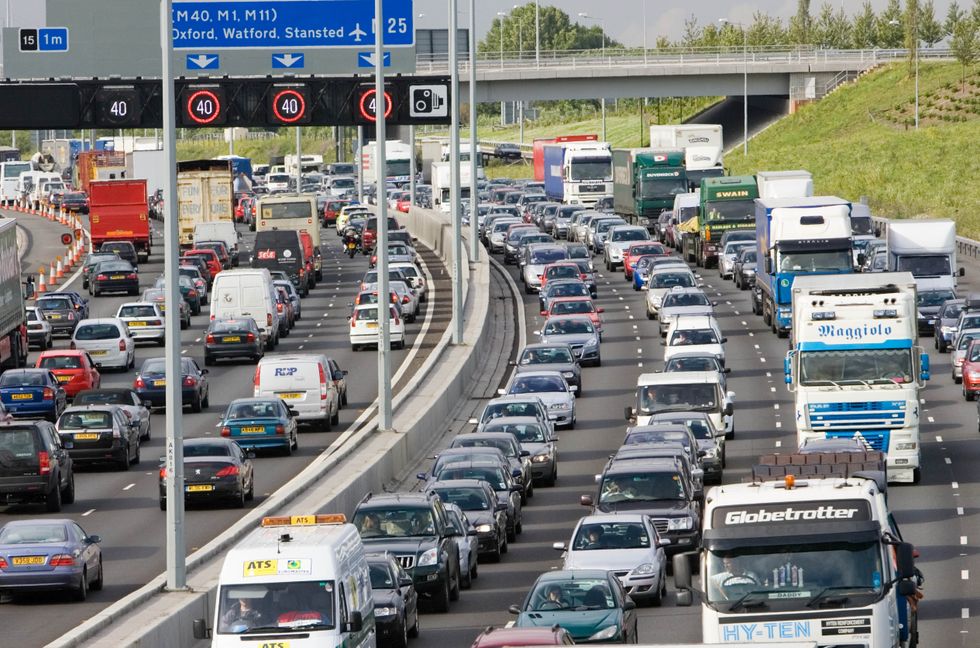
At the other end of the scale, the M60 around Manchester showed significantly lower speeds at 53.4mph. The M621 recorded one of the most substantial slowdowns, dropping to 43.3mph. The M25, London’s orbital motorway, also struggled with congestion, averaging just 53.6mph.
But local A roads paint a different picture, with average speeds actually increasing by 0.9 per cent to 23.6mph during the same period.
Among the slowest routes in the network, the A2270 recorded a mere 13.4mph average speed, making it one of the most congested major roads in England. The A57 showed similarly challenging conditions, with speeds dropping to just 15.5mph.
Southampton’s A335 rounds out the trio of slowest major routes, with vehicles averaging only 18mph. Other notably slow routes include the A663 at 22mph and the A5036 at 24mph.The A41 also experienced significant congestion, with average speeds of just 26.1mph.
The A308(M) and A5127 also showed concerning performance, with speeds of 30.7mph and 31.7mph respectively. Regional analysis revealed the Greater London Authority area recorded the lowest average speeds at 51.4mph, showing the capital’s continued struggle with congestion.
In contrast, Peninsula Transport area maintained the highest regional speeds at 60.4mph, demonstrating better traffic flow in the South West.
England’s Economic Heartland performed well with speeds of 58.6mph, while Transport for the North averaged 57.2mph. The South East maintained steady performance with Transport for the South East recording 57.4mph.
Transport East saw speeds drop to 55.4mph, while Midlands Connect registered 56.7mph. The Western Gateway area achieved 57mph, positioning it in the middle range of regional performance.
These regional variations highlight significant disparities in traffic flow across England’s major road network. Looking at Combined Authority data, the West Midlands recorded the lowest average speed at 47.3mph, showing a significant decline from previous years.
LATEST DEVELOPMENTS:

M25 had speeds averaging just 53.6mph
GETTY
Cambridgeshire and Peterborough maintained stronger performance with speeds of 58.9mph, leading the Combined Authority areas.
Greater Manchester saw speeds drop to 54mph, while Liverpool City Region maintained slightly higher speeds at 56.5mph.West Yorkshire and South Yorkshire both experienced notable slowdowns, recording 56.9mph and 58.3mph respectively.
The North East Combined Authority maintained steady performance at 55.4mph, while North of Tyne showed a slight improvement at 55.5mph. Tees Valley recorded 56.9mph, while the West of England saw speeds decrease to 55.9mph.