Segment review #1, Games 1-10
All too often during a hockey season, it’s easy for us fans to get focussed in on “last game” or “current streak”, or alternatively to zoom all the way out to “entire season to date”. For many years here at the Cult of Hockey, we have regularly featured an intermediate magnification of 10-game segments, roughly three-week bites. These are long enough to reflect significant trends of play by the team of interest, that of course being the Edmonton Oilers.
Of course the first such segment each fall doubles as the “entire season to date”, which tends to exaggerate those early trends. Especially in years of slow starts, as Oiler fans are experiencing for a second straight October. Indeed, it’s the third consecutive campaign the locals have hit the skids for a 10-game stretch in the first quarter. Let’s go back a couple of seasons just to provide some context, with the ugly early segments featured in bold font.
Season to date by segment
2022-23
Games 1 -10: 7-3-0, .700 | 41 GF, 32 GA | 334 SF, 338 SA | 1.028 PDO
Games 11-20: 3-7-0, .300 | 25 GF, 40 GA | 304 SF, 346 SA | .964 PDO
Games 21-30: 7-3-0, .700 | 43 GF, 30 GA | 317 SF, 313 SA | 1.040 PDO
Games 31-40: 4-4-2, .500 | 33 GF, 31 GA | 332 SF, 289 SA | .992 PDO
Games 41-50: 7-1-2, .800 | 45 GF, 28 GA | 367 SF, 310 SA | 1.032 PDO
Games 51-60: 4-2-4, .600 | 43 GF, 36 GA | 360 SF, 324 SA | 1.008 PDO
Games 61-70: 7-3-0, .700 | 44 GF, 34 GA | 295 SF, 323 SA | 1.044 PDO
Games 71-80: 9-0-1, .950 | 44 GF, 22 GA | 364 SF, 289 SA | 1.045 PDO
2023-24
Games 1 – 10: 2-7-1, .250 | 27 GF, 41 GA | 334 SF, 302 SA | .945 PDO
Games 11-20: 5-5-0, .500 | 39 GF, 33 GA | 328 SF, 272 SA | .998 PDO
Games 21-30: 7-3-0, .700 | 37 GF, 29 GA | 371 SF, 271 SA | .993 PDO
Games 31-40: 10-0-0, 1.000 | 37 GF, 16 GA | 340 SF, 278 SA | 1.051 PDO
Games 41-50: 7-3-0, .700 | 35 GF, 25 GA | 310 SF, 284 SA | 1.025 PDO
Games 51-60: 7-2-1, .750 | 37 GF, 29 GA | 324 SF, 286 SA | 1.013 PDO
Games 61-70: 5-3-2, .600 | 38 GF, 30 GA | 364 SF, 294 SA | 1.002 PDO
Games 71-80: 6-2-2, .700 | 39 GF, 23 GA | 341 SF, 268 SA | 1.029 PDO
2024-25
Games 1 – 10: 4-5-1, .450 | 22 GF, 35 GA | 343 SF, 261 SA | .930 PDO
–
In 2024-25 the underlying numbers suggest the Oilers have been carrying the play. They’ve had 56.8% of the shots on goal, outshooting their opponents by an average of 8 per game. This flow of play is largely backed up by our own video analysis here at the Cult of Hockey though the margins are narrower; we have the Oilers with 54.3% of Grade A shots and 52.6% of the most dangerous, 5-alarm chances.
Shots and chances are all well and good, but one doesn’t need to go any further than the awful goals results in those poor segments to explain those crappy W-L-O records. 25 for, 40 against in the second segment two seasons ago. 27 for, 41 against in the opening 10 last year. Now an equally brutal 22 for, 35 against to kick off the new season. Less than 40% goal share each time over a 10-game stretch, a recipe for unhappiness.
Fact is the 2024-25 Oilers can be considered fortunate to collect 9 standings points from the opening 10. They went 3-0-1 in close games but 1-5-0 in those decided by 3 or more goals. Three times the Oil were lit up for 5+ goals in a game. Meanwhile, there were no games at all where they scored 5 at the good end, a feat the squad accomplished 21 times a season ago.
Overall, the 22 goals scored were the poorest yield in any such segment in the last seven seasons. One has to go back to 2017-18 to find a similar low yield, and to Connor McDavid‘s rookie campaign in 2015-16 to find a weaker one.
It’s not supposed to be this way. McDavid is a five-time scoring champion, and his faithful sidekick Leon Draisaitl has an Art Ross in his trophy case as well. Including playoffs Zach Hyman scored 70 goals a season ago, while Evan Bouchard scored 114 points from the back end in 106 regular season and playoff games. Ryan Nugent-Hopkins was a 100-point scorer the year before. To that core group of deadly snipers the Oilers added Jeff Skinner, ten times a 20-goal scorer; Adam Henrique with seven such seasons; Viktor Arvidsson with five. This team was built to score.
So what’s going on? While there are far too many underlying causes to detail here, let’s just say the percentages are running hard against the Oilers, and at both ends of the ice. The shooters can’t seem to buy a goal; the stoppers. a save. (Or the coaches a challenge for that matter.)
This is an updated version of a table we published after the opening segment a year ago. Just 2 columns here, the Oilers’ W-L-O record alongside their PDO in each segment over the past 5+ seasons.
PDO doesn’t stand for anything really, although I like “Percentage-Driven Outcomes” as a useful backronym. Others simply refer to it as “luck”, though there’s more to it than that. It’s simply the combination of a club’s shooting and save percentages, with a balance point of 1.000 if both sides are converting their shots at the same rate. The Oilers have been pleasingly north of that figure in each full season, and in the majority of segments within. A key reason they made the playoffs each and every year.
A cursory examination of the data shows that those percentages are serious drivers of both good and bad outcomes. The latter are highlighted with pink backgrounds; generally speaking the brighter the pink, the more embarrassing the results. The whole point of producing this table a year ago was to show how completely out of character was Edmonton’s .945 PDO last October, the worst in five seasons by about 20 basis points (2.0%).
Well, records are made to be broken. The new mark of .930 is fully 15 basis points worse than last season’s atrocity. It’s founded on a terrible shooting percentage of 6.4% and am also-terrible save percentage of .866 = opposition Sh% of 13.4%. Put another way, Edmonton’s opponents were more than twice as likely to convert a shot into a goal. That’s a losing proposition no matter how much one dominates territorial play.
Is it just luck? Certainly that has a role to play, but there’s more to it than that. I liked the description of analyst Rachel Doerrie, guesting on Sports 1440‘s “The Lowdown with Lowetide” the other day. She told host Allan Mitchell that her interpretation of those numbers is simply that the Oilers have been losing too many of the important battles. Thinking back on the games so far, all I could do was nod my head, remembering too many plays where an opponent established inside position on an Edmonton defender and not enough where an Oilers attacker did the same, or converted his shot or deflection opportunity when he got there. I suspect all can agree that no matter what the shots data might indicate, the team has not been sharp.
The good news here is that in each of the last two years the Oil rebounded sharply after their bad early stretch. In each campaign the bolded sections represented their season-worst results in both GF and GA; in fact Edmonton outscored their opponents in each and every one of the other 14 segments. One hopes that the opening set in 2024-25 will similarly be a blip on the radar, but Oil fans do not yet have the comfort of seeing their team put together a positive run of games. At the moment, this unsatisfactory ten-game block is all the information we have.
The job just got a whole lot harder with the recent ankle injury to McDavid. Unlike a year ago when the likes of Mattias Ekholm, Ryan McLeod and McDavid were dealing with physical issues in the early going, this year’s squad was fully healthy for the first 10 games, utilizing just 21 players in the process. Only in Game 10 when McDavid departed early was a game impacted in any way by an absence.
Alas, even with all hands on deck the squad slogged its way to a poor set of games, placing them well below the playoff cut line entering a second segment in which McDavid may not play at all. It’s not an enviable situation, though it’s the sort of challenge where a true championship contender tends to step up and show both its depth and its mettle.
Goalies
Let’s turn now to the individual side for a statistical summary and brief commentary, starting as usual with the netminders. Stu Skinner has had the most work, Calvin Pickard has posted the best results, but neither has stopped enough pucks as the save percentage column shows. For each man, a brutal first start has been a drag on the numbers since the get-go.
Defencemen
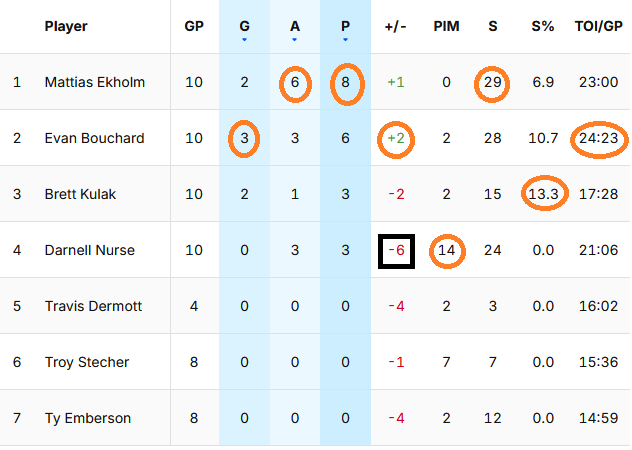
Oilers top pair of Mattias Ekholm and Evan Bouchard has been holding its own but not outscoring in its established fashion. Vets Brett Kulak and especially Darnell Nurse have had a revolving cast of partners with mediocre-to-poor results. The bottom three of relative newcomers to the squad are all struggling in their own zone with nary a sniff of offence to this point. The new-look D corps is very much a work in progress.
Forwards
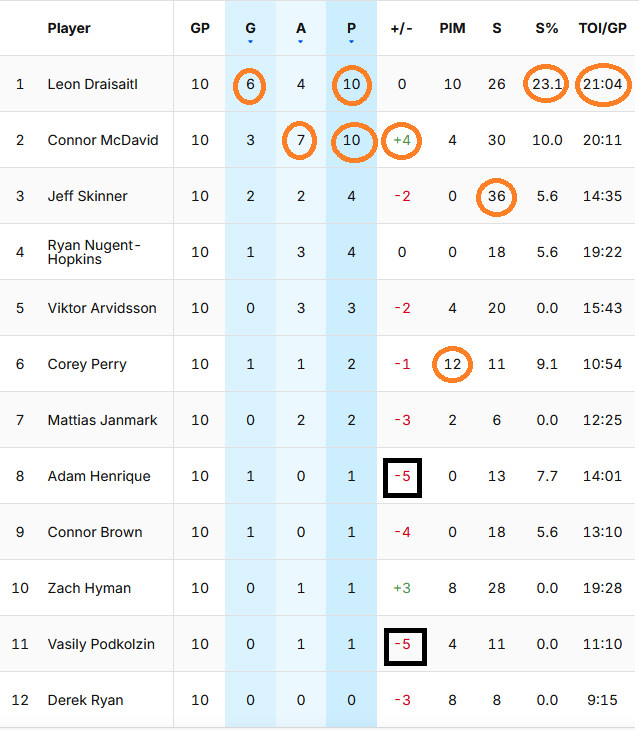
The Oilers feature the usual pair of leading lights, though with “just” 10 points each even Connor McDavid and Leon Draisaitl are well below their established scoring rates. Below them it’s a massive drop-off with no other forward averaging even half a point per game.
The forwards as a group have lit the lamp just 15 times, a terrible number, with the bottom nine as listed having combined to score just 4 goals. Just one forward (Draisaitl) mustered a shooting percentage above 10%.
On the one hand, that is nowhere near good enough. On the other? There’s nowhere to go but up.
Player grades
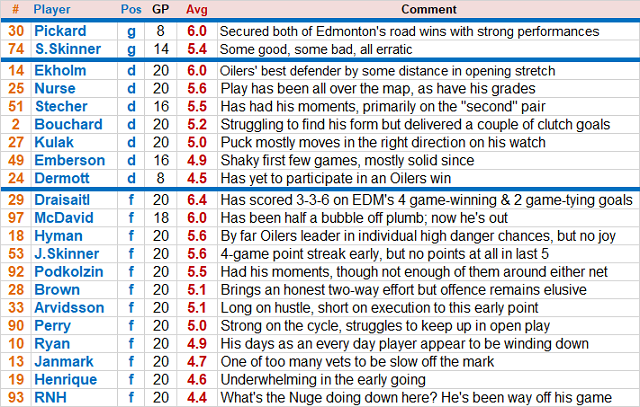
We close in our usual fashion by reviewing the set of 10 games through the lens of our own subjective ratings here at the Cult of Hockey. Regular readers will know that we grade on a scale of 1 to 10, the performance of every Edmonton Oilers player in every game the team plays, based on a combination of observation and interpretation of statistical output. Here are average grades for Games 1-10 along with our customary thumbnail comment summarizing each player’s contribution over that span:
Results by grader, first segment:
- David Staples — 4 games, 2-2-0, average grade 5.8
- Bruce McCurdy — 3 games, 1-2-0, average grade 4.9
- Kurt Leavins – 3 games, 1-1-1, average grade 5.0
- Segment totals – 10 games, 4-5-1, average grade 5.3
Recently at the Cult of Hockey
McCURDY: Oilers shuffle lines, pairings, goalies, powerplay
McCURDY: McDavid out 2-3 weeks with ankle injury, Oilers announce
STAPLES: Oilers looking “more aggressively” for blueline help
McCURDY: With McDavid out, Oilers call up two from Bako
STAPLES: Player grades from blowout loss in Columbus
STAPLES: Hockey world reacts to Connor McDavid injury
McCURDY: Player grades in big win over Detroit


Follow me on X-Twitter @BruceMcCurdy


