When we dug into the the topic earlier this season in a post pointedly headlined Addressing the elephant in Edmonton Oilers’ room, goaltending was in a spot of bother. The Oilers had just lost 4-3 in overtime in Toronto, reducing their record through 18 games to 9-7-2, about as mid as mid can get. To that point, the netminders had yet to prove they were more part of the solution than the problem.
In that piece I pointed out that the NHL squad has the low-low budget of $3.6 million for what many see as the game’s most important position, less than 28 other NHL clubs and more than just three. That their goalies would prove to be “value contracts” was equal parts expectation and essential to the team’s success. After all, the same combination of Stu Skinner and Calvin Pickard had backstopped the club all the way to Game 7 of the Stanley Cup Finals the previous spring.
But in the first quarter of the season the results simply were not there. By one team measure cited in the post (Natural Stat Trick), the Oil ranked 30th in the NHL in Goals Saved Above Expected. By another (Money Puck) that analyzed individual ‘tenders, Skinner ranked dead last in the entire NHL in the raw count of that same measure.
Seven weeks later, the waters have calmed to a significant degree, even as questions remain. This is, after all, the ever-jittery Oil Country, where the last time fans were truly happy with the local squad’s netminding may have been that one season Grant Fuhr and Andy Moog both made the Campbell Conference All-Star Team.
These times are not those times, but neither are they the worst of times. The netminding has stablilized, especially Skinner who has already regressed (in a good way) back toward the mean, and strongly so.
We’ll dig into his results in a bit, but first let’s visit the process. How has Oilers coach Kris Knoblauch changed his approach to deploying his goalies?
The short answer is, he hasn’t. Knoblauch continues to use his tandem exactly as he has all season. The pattern has simply become clearer with time.
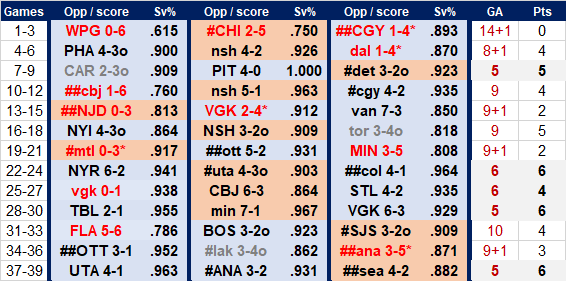
The principle is that the coach has divided the entire slate to this point into 3-game sets. Here’s a full game log presented in such a manner:
- Skinner’s starts are represented by blue backgrounds, Pickard’s by orange. Skinner starts 2 games of every 3, and Pickard gets the other. Time after time after time. Pickard has never started more than 1 game in a row at any point, while Skinner has started as many as 3 straight games a handful of times but never more than that.
- # symbols represent back-to-back games, of which there have been eight sets already. Each has been split between the two men.
- Wins of all types are in black font, overtime losses in grey, regulation losses in red. Lots of red ink in the top half of the table, in which the Oilers suffered 9 regulation losses in their first 21 games. Since then, just 3 such defeats in 18 games.
- Asterisks in the game score indicate an empty net goal is included in the opposition’s total. Always a singleton; Knoblauch has yet to join the growing legion of NHL coaches who will pull their netminder repeatedly in the same game with predictable results.
- In every game but the (disastrous) season opener, the starter has gone the full distance.
The two columns at far right show the outcomes of each 3-game set, in goals against and standings points. Somewhat surprisingly given the arbitrary nature of the dividing line, the GA totals cluster into three distinct groups which can be directly tied to Edmonton’s success in those sets of games:
- 15 GA — one occurrence, with a well-deserved 0-3-0 record for 0 points = .000 Pts%
- 9-10 GA — seven occurrences, overall record of 11-8-2 for 24 points = .571 Pts%
- 5-6 GA — five occurrences, overall record of 13-1-1 for 27 points = .900 Pts%.
All of which amounts to yet more evidence that success in goal suppression equals success in the standings. 2 goals against per game is significantly better than 3 and much much better than 5… who knew?
The good news is that terrible opening set continues to stand alone as a major exception to the norm, while the clusters of good defensive results have become more commonplace as the season has progressed.
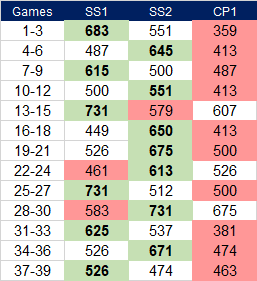
Digging a little deeper into Knoblauch’s methodology, another fact becomes crystal clear: he entrusts his #1 man with by far the lion’s share of the most meaningful games. Here’s another look at the same 39 games, this time showing simply the (current) points percentage of Edmonton’s opponent in each contest. For clarity we have reordered the games slightly in order that all of Pickard’s starts appear in a single column.
- Green backgrounds represent the highest Pts% and presumably the toughest opponent, of each 3-game set. Skinner has gotten that game each and every time.
- Red backgrounds reflect the lowest Pts% and in theory the weakest opponent of a given set. Pickard has gotten that game 10 of 13 times. The other 3 times he got the team in the middle (blank background).
- Not all 3-game sets are created equal. For example, the recent trio against Utah, Anaheim and Seattle doesn’t really compare to an earlier run against Tampa, Minnesota and Vegas. But Knoblauch has stuck to his guns of consistently giving Pickard a third of the starts.
On average, Skinner’s opponents have a Pts% of .582, Pickard’s just .478. Put it through another filter, Skinner has started 15 games against teams currently in a playoff spot, Pickard just 2. Compare that to an 11-10 split of games against teams below the wild card cut line. Even there, Skinner has played 6 of 6 games against the 9th and 10th place clubs of the two conferences, whereas Pickard has played 7 of 9 games vs. teams ranked 13th-16th on one side or the other.
Important to note that the team percentages are those of today (through 2025 Jan 04) and not of the relevant game day. To cite an extreme example, New York Rangers were flying high at 12-5-1 = .694 when they faced Skinner and the Oilers on Nov 23 (and lost 6-2); as this post is being researched they have dropped all the way to .474. Nonetheless, it is that latter number that serves as a quick-n-dirty measure for our purpose, which after all is a blog post, not a master’s thesis. Relative team strength is a fluid subject to put it mildly. Nonetheless, we have overwhelming evidence already that however you slice it, Stu Skinner is the main man and Calvin Pickard the understudy.
Which yields slightly deceptive results when comparing the stats of the two. Pickard has posted a .692 Pts% based on 9-4-0, while Skinner’s 15-8-3 yields a slightly lower but still-impressive .635. Pickard’s 2.47 goals against average compares favourably to Skinner’s 2.78, even as they both have posted the identical save percentage of .898, just a couple of ticks below the league average of .900. Difference being the Oilers have limited the weaker opponents in Pickard’s starts to 24.1 shots per game, while those in Skinner’s contests have averaged 27.3 shots. More shots against = more goals against, go figure. Even before one takes into consideration the higher calibre of shooters and offensive creativity inherent in the tougher opponents.
One area where the two are truly equal is in goal support. The Oilers have averaged scoring 3.2 goals per game with each man in the pipes.
Let’s return for a moment to Skinner’s crummy GSAx that ranked dead last of all NHL stoppers seven weeks ago. In the interval from then to now, Skinner has yielded 33 actual goals against 39 that might be expected based on the numbers and quality of shots he has faced. The poor -9.3 GSAx he was sporting at that time has melted away to -3.3 by Money Puck‘s reckoning.
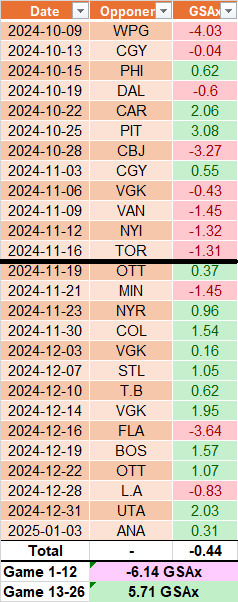
Another site, Evolving Hockey, digs into goalie performance using somewhat different formulae and advanced wrinkles such as score and venue adjustments. Columns and columns of data points, which are reduced here to the derived outcomes of Goals Saved Above Expected, green when positive, red when negative.
The black line under Game 12 coincides with the date of our “elephant in the room” post, and reflects that Skinner had quite a few more tough nights than good ones in the opening weeks but turned things around immediately thereafter. See the splits at the very bottom which show that Skinner has recovered from a poor net figure of -6 goals through 12 games all the way back to nearly break-even today.
My take is that Kris Knoblauch has a very good understanding of his netminders and has developed a simple yet efficient methodology for employing both to their strengths. The bigger takeaway is that both have raised their game as the season has progressed, especially Stu Skinner who seems to be the goalie of record any time the Oilers face a league power or hot divisional rival. That he is facing such teams disproportionately is certain to have a deleterious effect on his percentages but for the third season in a row his game has rounded into form as surely as the calendar turns from November to December.
Ultimately, of course, as with any position the big questions around Oilers’ goaltending will only be answered in May and (one hopes) June. But as of now, things are trending up, up, up.
Recently at the Cult of Hockey
STAPLES: Player grades from mostly-impressive win in Seattle
McCURDY: Draisaitl breaks open another game — player grades vs. Ducks
STAPLES: Oilers move 54-goal scorer to third line
McCURDY: Save one minor detail, 2024 was a great year for Oilers
LEAVINS: Player grades from 4-1 win over Utah HC


and on Bluesky Social @brucemccurdy.bsky.social
Follow me on X-Twitter @BruceMcCurdy
and on Bluesky Social @brucemccurdy.bsky.social


